Risk Scoring
Optimizing Fraud Risk Scores
North American Payment Processor ($5B annual volume)
🚨 Challenge
High false positives: 12% of legitimate transactions declined; yet >$1M/month fraud losses persisted.
💡 Solution
Built a composite risk score (doc, bio, device, phone, velocity); ROC‑curve thresholding; delivered analyst‑friendly explainability dashboards.
📈 Impact & Results
False Positives ↓
≈45%
Fraud Losses ↓
≈37% in 6 months
Analyst Productivity
≈2×
Visual Impact Analysis
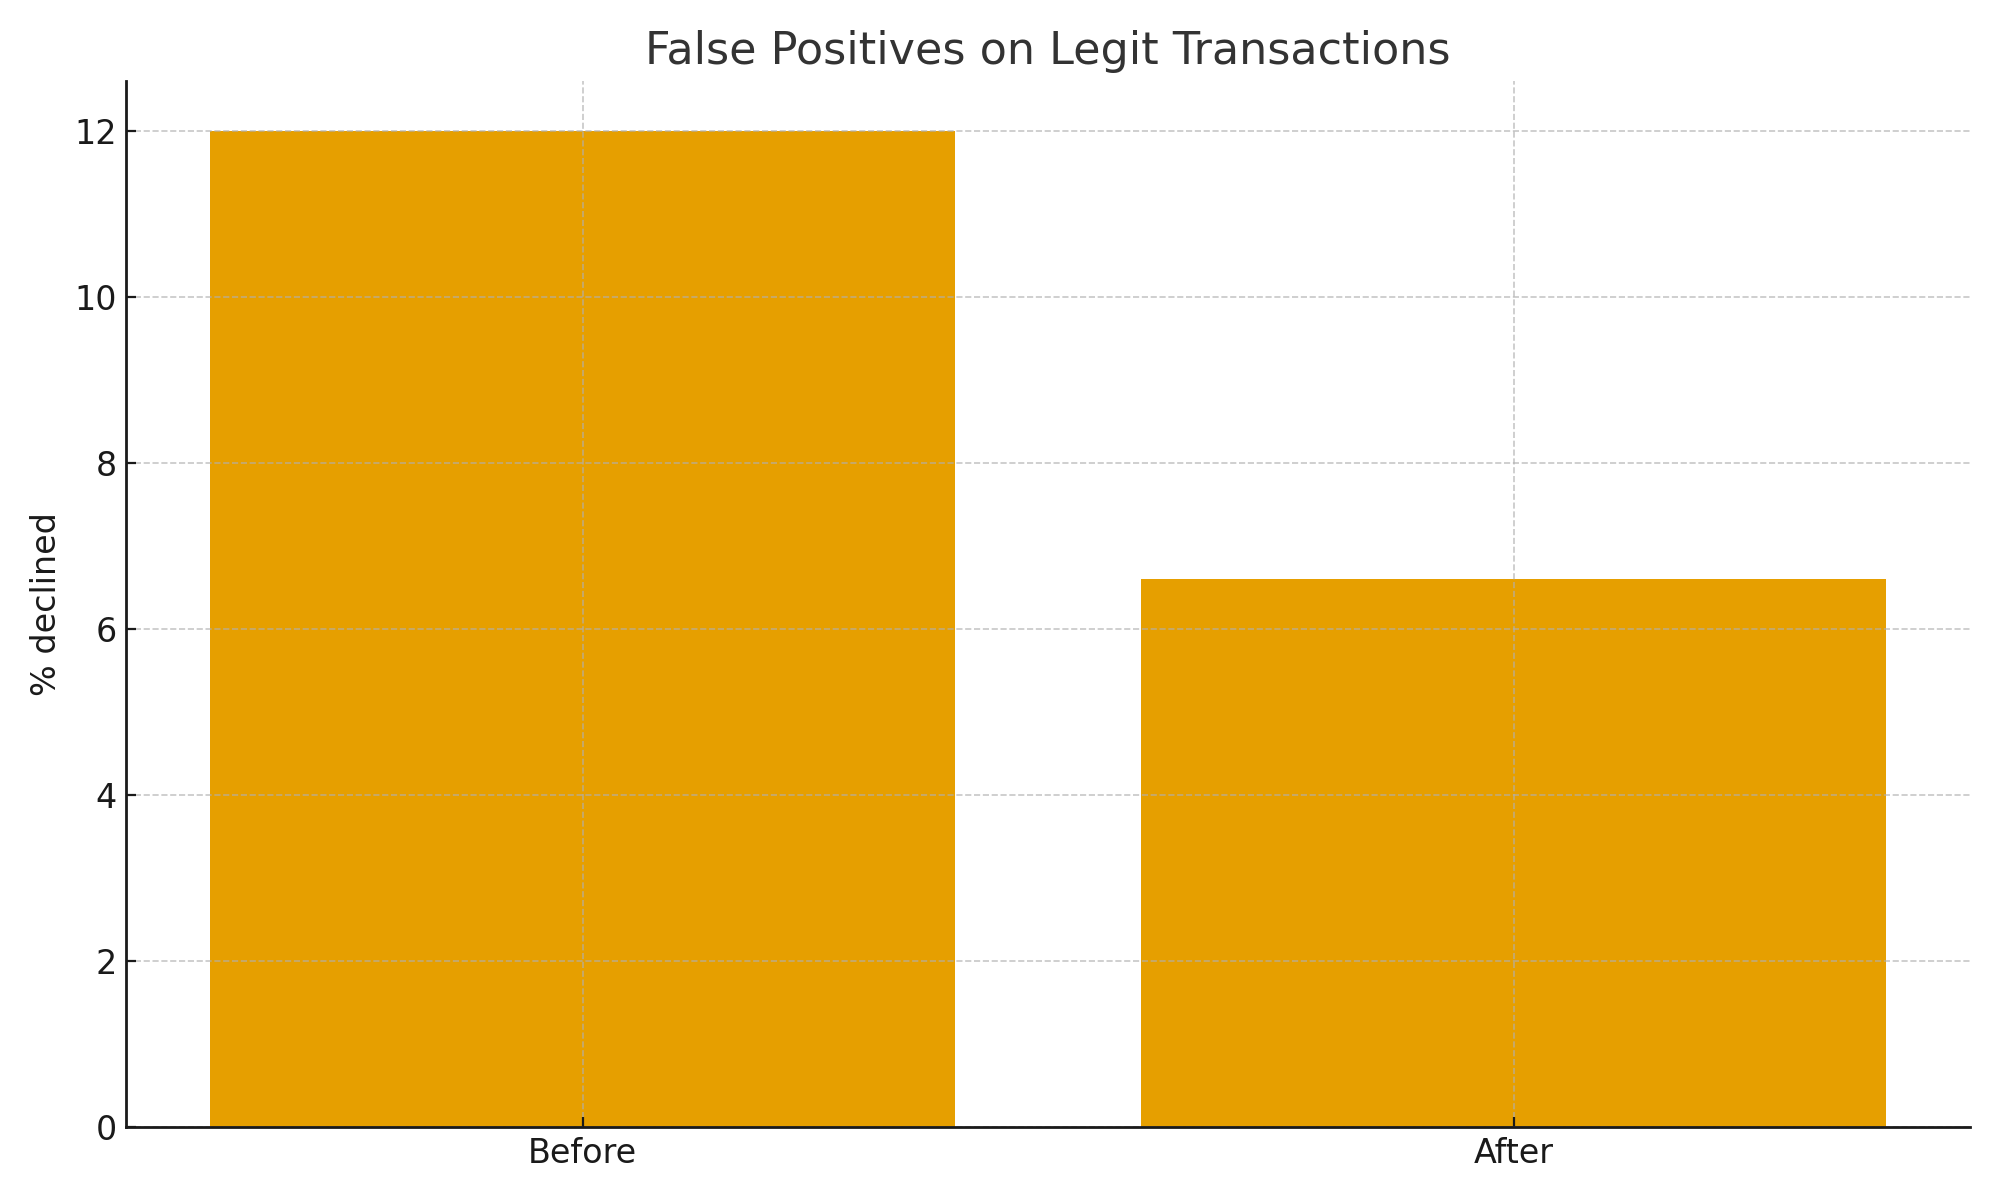
False Positive Rate Reduction
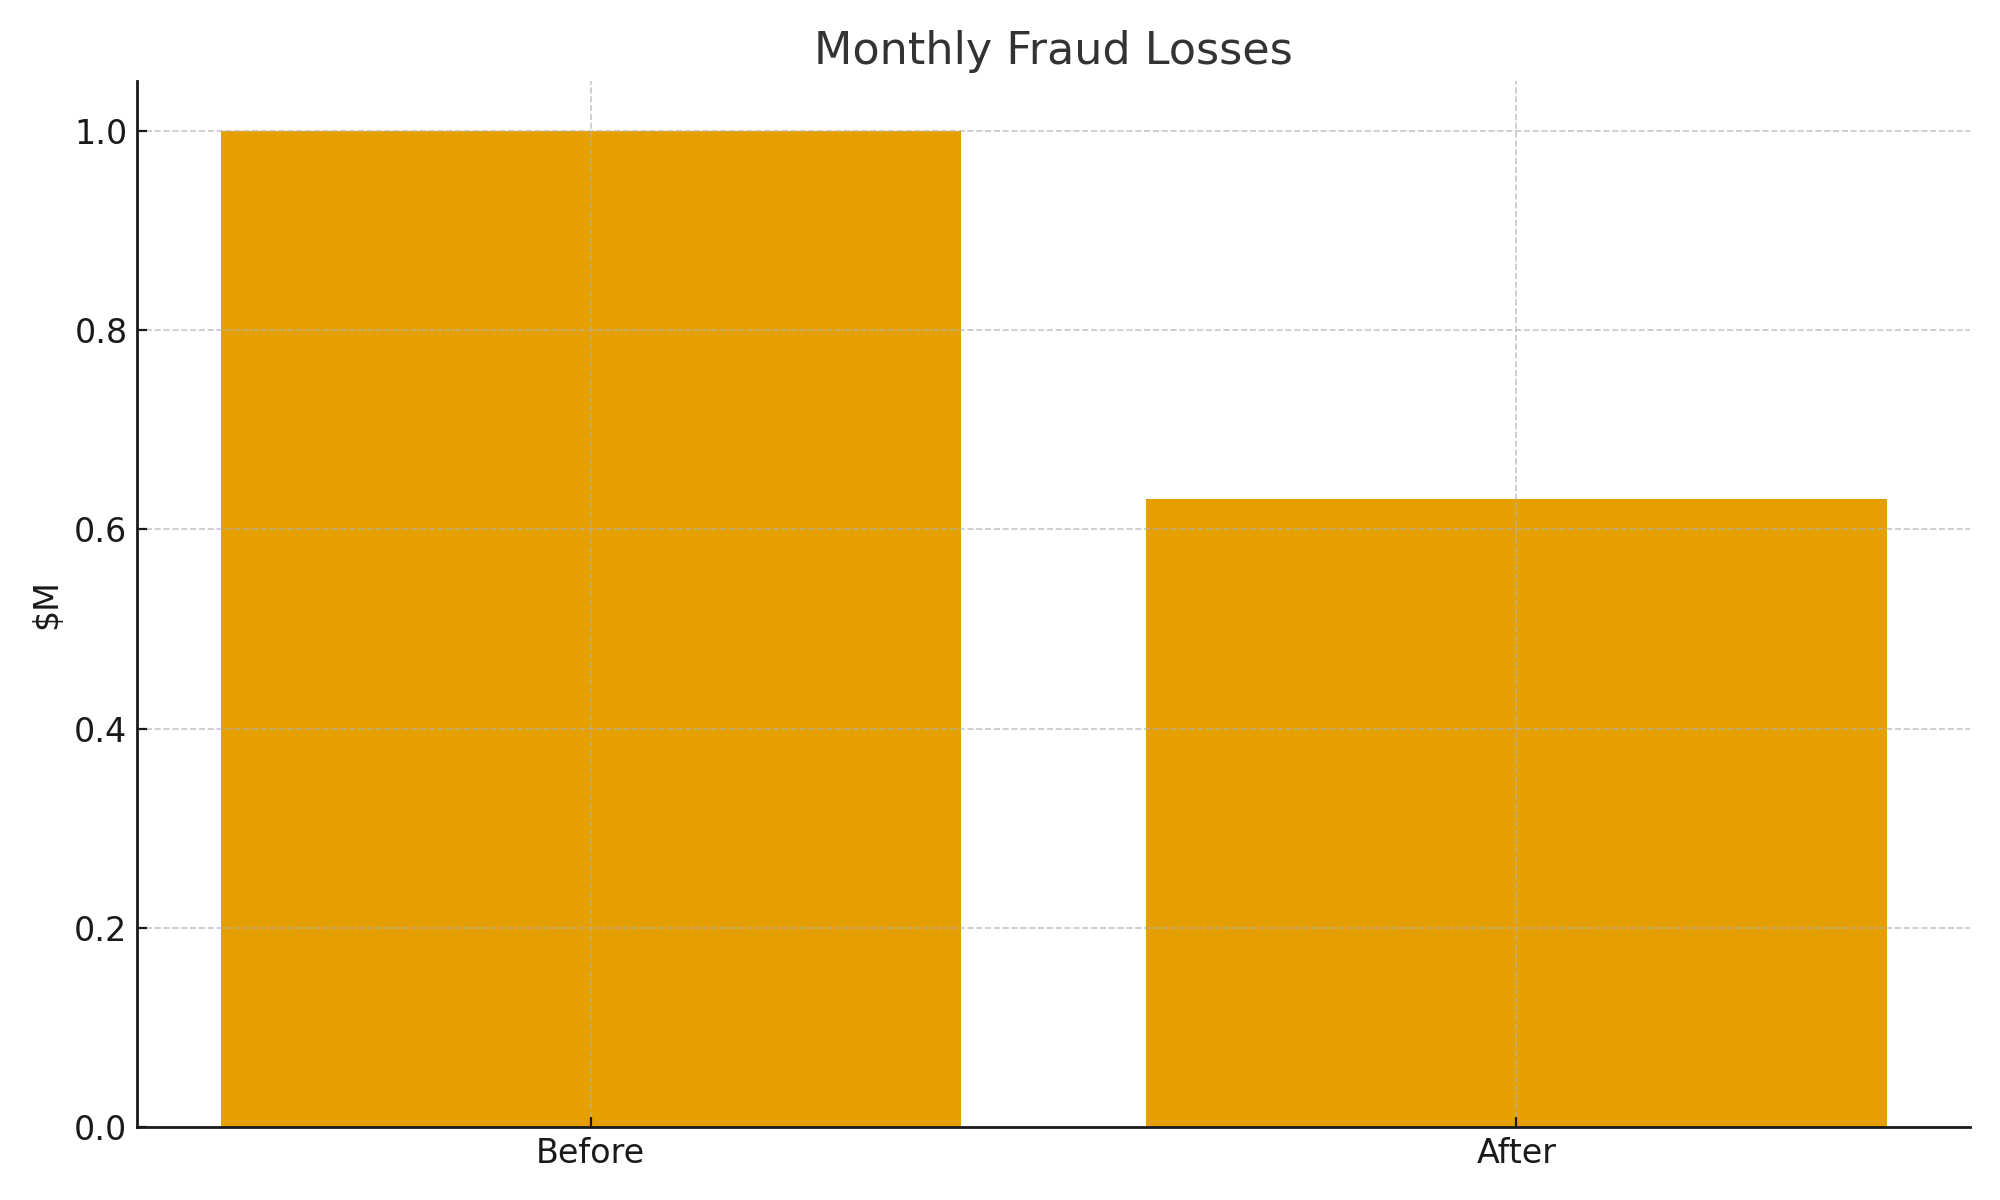
Monthly Fraud Loss Reduction
Hypothetical, representative engagement for illustration.